
Generic reviews for rent. Pre-written micro-reviews licensed to any company. Reviewers have never used your product—and that's the point. A Testimoney product.
Military-Grade Attribution infrastructure for powered-by labels. 99.99% uptime SLA for your footer text.
Frequently Unasked Questions. FUQbuddy is the premier hosted FUQ and support platform where customers can find answers to questions they never asked—and never will. Self-service support for the hopelessly self-sufficient.
An AI that helps gamblers cheat in casinos, since technically it's only illegal when a human does it.
Where hobos find their soulmate.
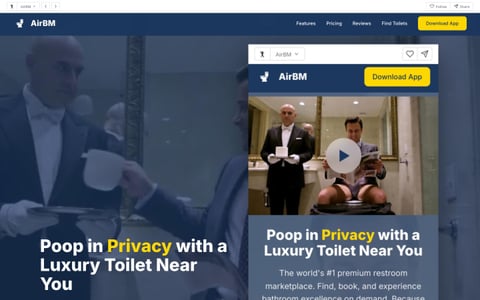
Poop in privacy with a luxury toilet near you. Download our app to start downing your load.
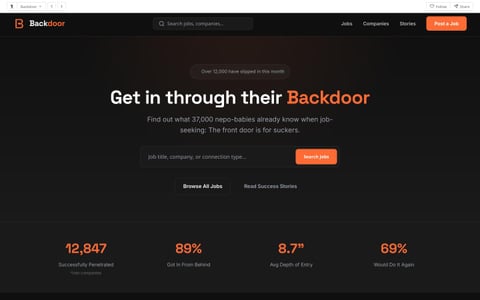
See how people really get hired. Skip the front door and slip in through the back.

 Praisetitute
NEW
Praisetitute
NEW

 Powerbottom
NEW
Powerbottom
NEW

 FUQbuddy
NEW
FUQbuddy
NEW
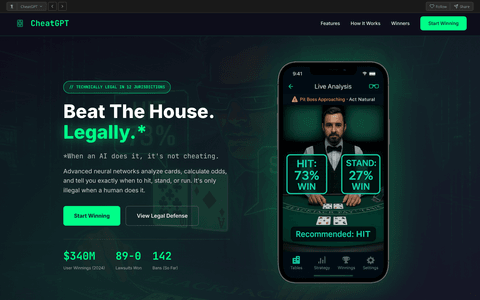
 CheatGPT
NEW
CheatGPT
NEW
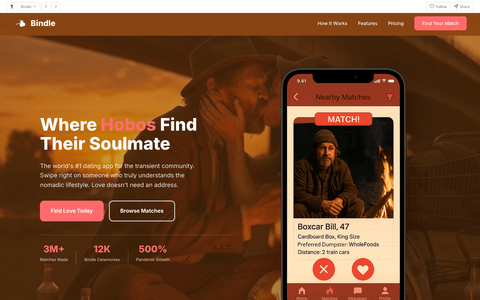
 Bindle
HOT
Bindle
HOT
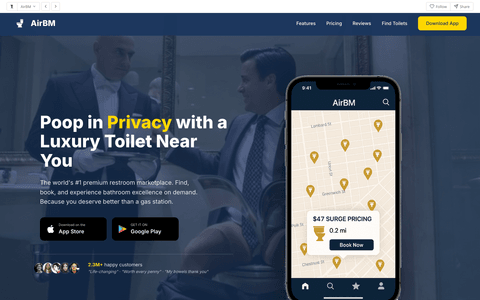
 AirBM
NEW
AirBM
NEW
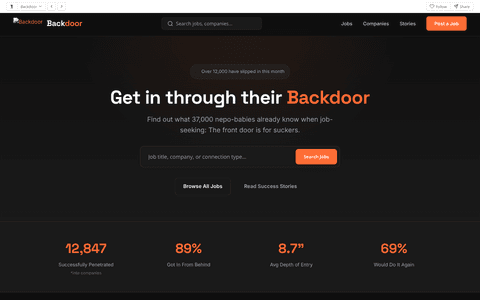
 Backdoor
NEW
Backdoor
NEW
 101.1 The Butt
AirBM
101.1 The Butt
AirBM
 Alley Wae
 Analies
 Asshology
Backdoor
Asshology
Backdoor
 Balenciaga
 BeatKids
Bindle
BeatKids
Bindle
 BrokeIn
 Carousell
CheatGPT
Carousell
CheatGPT
 Church of the Universal Nomadic Traveler
 Comeo
Comeo
 Cornkast
 Cryer Liars for Hire
 Cunilingo
 Dumpster Dash
 EnableMe
FUQbuddy
EnableMe
FUQbuddy
 Gravy Corps
 GruntGPT
 Gruntslate
 Gutter
 H.O.L.E.
 Handy Jobs
 Incestry
 Informer
 Jail Baste
 Kool Kids Korner
 Lunch Income
 Mid
Mid
 Minor Miners
 OgleMe
 OnlyStrands
 Pawper
 PedroFile
Powerbottom
Praisetitute
PedroFile
Powerbottom
Praisetitute
 Prank Call Call Center
 Prankcast
 Ruff Translations
 Second Chances
 Shedroll
 Shilling
 ShopLift
 SidePiece
 Sister Grace's Oasis
 Solicit
 Swipe
Swipe
 Take-A-Wish Foundation
 Tattots
 Terminal
 Testimoney
 The Clerkies
 Thots and Prayers
 TinyVag
 Trampaigns
 UnderPass
 V Contaminator
 Vagibond Developers
 Vagibond Eats
 Vagibond Maps
 Vagibond University
 Vagibond Voyages
 Vagicon
 Vagifind
 Vagify
 Vagipages
 Vagrance
 Vibe Raters
 Vmail
Vmail
 Vogue Pervert
 Zilcho
Decades of behavioral research have revealed a simple truth: investors don't read spreadsheets. They react to visual stimuli. We've optimized for that.
The institutional investor brain has been extensively studied. The findings are remarkably consistent.

Research from Stanford's Behavioral Finance Lab found that institutional investors spend an average of 4.7 seconds evaluating each page of a pitch deck. That's less time than it takes to read this paragraph.
When presented with a wall of numbers versus a colorful chart showing upward trajectory, eye-tracking data shows investors fixate on the visual 94% of the time. The numbers might tell a different story. But nobody's reading the numbers.
"We don't need them to understand the data. We need them to feel the data." - Anonymous Series B Founder

The human brain evolved to recognize patterns, not analyze spreadsheets. When an investor sees a hockey-stick curve, their brain immediately associates it with success stories they've heard about. Amazon. Tesla. That app their nephew won't stop talking about.
They don't need to verify the data. The shape is enough. The pattern triggers an emotional response that bypasses rational analysis entirely.
"I've never lost money on a company with a good-looking chart." - Unnamed Partner, Major VC Firm
Investors are, at their core, deeply insecure. They're haunted by the deals they passed on. Every chart that shows explosive growth triggers a primal fear: "What if this is the next big thing and I miss it?"
This fear is far more powerful than due diligence. A beautiful chart doesn't just show growth - it creates urgency. It suggests a train leaving the station. And nobody wants to be left on the platform.
"I passed on Uber. I passed on Airbnb. I'm not passing on this chart." - Angel Investor, 2023
Every Analies chart is built on these foundational truths about investor behavior.
The brain processes visual information 60,000 times faster than text. We leverage this by making sure your chart is the first thing they see - and the only thing they remember.
Investors want to believe. They're looking for reasons to say yes. A hockey-stick chart gives them the permission they need to follow their gut instead of their spreadsheet.
Growth curves create momentum. The steeper the line, the more urgency investors feel. Our algorithms optimize for maximum emotional impact per pixel.
Complex data creates doubt. Simple visuals create confidence. We reduce everything to a single beautiful curve that even a sleep-deprived VC can understand at 2am.
The best defense against due diligence is offense. Our distraction charts feature puppies, ice cream, and other elements proven to redirect investor attention.
Every Analies chart is technically accurate within extremely generous interpretive parameters. Our legal team has verified that curves can mean whatever you need them to mean.
Join thousands of founders who've discovered that the best investment thesis is a beautiful curve going up and to the right.
Start Your Free Trial